Quick answer
To compare running shoes with Garmin or Stryd data, compare runs from the same runner at similar pace, surface, grade, fatigue level, and sensor setup. Garmin running dynamics can support an indirect comparison through ground contact time, duty factor, vertical ratio, and derived Loading Pattern Index (LPI). Stryd is stronger for this specific question because it can add leg spring stiffness (LSS) and impact loading rate (ILR), which are more direct spring-mass and loading signals. Neither device makes one workout proof. The most defensible shoe signal is a repeated pattern across comparable runs. For marathon build-ups, use the same repeated-run logic to assign daily, tempo, and race roles in a marathon shoe rotation.
Garmin is useful, but still indirect
Garmin running dynamics are useful for shoe comparison because they record how you move in the shoes you actually run in. Garmin defines fields such as cadence, ground contact time, stride length, vertical oscillation, and vertical ratio as running-dynamics feedback. Those are legitimate movement signals, but they are not a standalone shoe verdict.
That context matters. One isolated run in shoe A and one isolated run in shoe B can be distorted by weather, route, surface, hills, fatigue, pacing, watch fit, wind exposure, or a shoe that is still breaking in. A cleaner single-session comparison is possible, but it has to be controlled carefully.
| Comparison type | Best use | Main caution |
|---|---|---|
| One isolated run versus another isolated run | Quick first impression when no other data exists. | Different weather, route, fatigue, wind, or pacing can dominate the result. |
| Back-to-back single-session test | The most direct one-day comparison: run both shoes on the same route, at similar effort, directly after each other. | Take a small recovery break, keep the order in mind, and account for wind or Stryd Air Power because air resistance can change the power cost. |
| Repeated matched runs | The stronger profile for your normal running style, including the overall best shoe for a purpose. | It takes more data, but it reduces the chance that one unusual run decides the answer. |
The back-to-back test is useful when you want the cleanest possible single-day head-to-head. Repeated behavior is better when you want the deeper answer, because not every run is the same. Across multiple comparable runs, Run-It can also compare fresh windows with fatigue or end windows, so the shoe decision includes how each pair holds up when you get tired, not only how it feels early in the run.
What Garmin can tell you about shoes
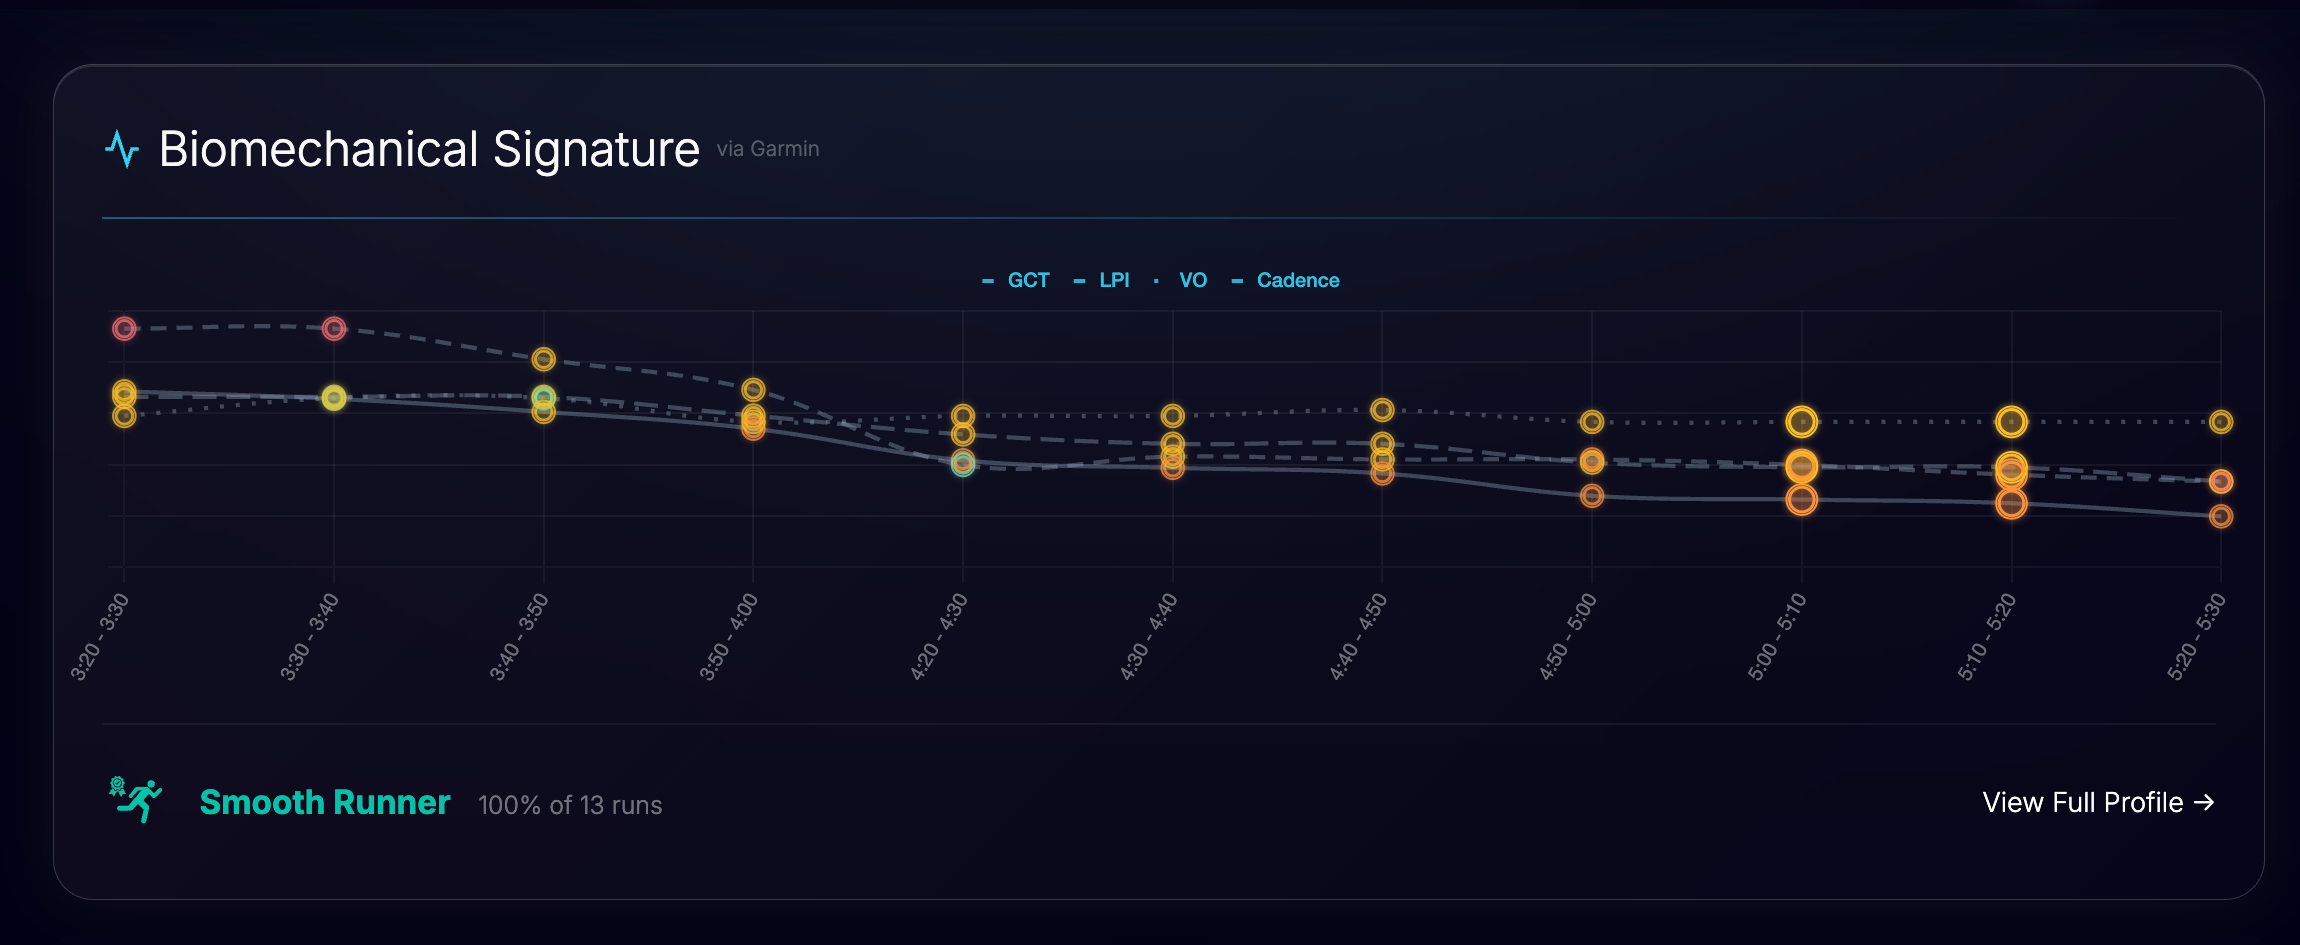
Garmin does not hand you a shoe score. It gives movement signals that become useful after they are read against pace and repeated context. Ground contact time shows how long the foot stays on the ground. Duty factor connects contact time with the step cycle. Vertical ratio describes vertical movement relative to forward stride. A derived LPI can give a shoe-relevant loading pattern signal.
For faster tests, a shoe that repeatedly shows lower contact time or lower duty factor at the same pace can be an efficiency clue. It does not prove the shoe is faster for everyone, and it does not even prove that this specific runner is automatically more efficient in that shoe. It is a signal to investigate: under matched conditions, the shoe may be helping the runner spend less of the stride cycle on the ground, but HR response, loading, comfort, and repeated behavior still have to agree.
Efficiency could indicate lower physiological cost
The goal of an efficient shoe is not a lower duty factor by itself. The goal is to reduce physiological effort at the same pace, surface, and effort target. In running-economy research, that is usually tested with oxygen or energy cost at a fixed submaximal speed. Wearables do not measure that lab result directly, so lower duty factor, lower GCT, or higher LSS should be read as clues that a shoe might be reducing effort, not proof that it is.
Average heart rate can add useful context because it is a practical wearable proxy for internal strain, but it is messy. Heat, hydration, sleep, stress, caffeine, altitude, illness, sensor quality, and cardiovascular drift can all move HR without the shoe being the cause. In the ideal field comparison, the stronger shoe signal is efficient mechanics plus a lower or steadier HR response across matched runs. Run-It's Drift Inspector estimates this by comparing fresh windows with fatigue or end windows, so you can see which shoe looks more HR-drift resistant and which pair holds its mechanics when you get tired. A true physiological winner would still need direct metabolic testing, so Run-It treats HR drift as an estimate, not a lab-grade measurement.

Useful for matched faster efforts, especially when the same runner sees the pattern repeat in the same shoe.

Leg spring stiffness helps describe spring-mass behavior. Impact loading rate describes how quickly force is applied at contact.
Why Stryd is more direct for shoe comparison
Stryd overlaps with several running dynamics fields and adds two signals that matter for shoe comparison. Stryd defines leg spring stiffness as a spring-mass model of the leg during ground contact, and impact loading rate as the initial rate at which force is applied when the foot contacts the ground. That makes the efficiency and loading comparison more direct than Garmin-only data.
The grounded wording is important: Stryd is not an automatic proof that one shoe is the best shoe on the market. It is more complete for this specific comparison because it provides native LSS and ILR fields, while Garmin-style shoe loading reads are more derived from running-dynamics patterns. LSS is especially relevant because spring-mass research linked leg stiffness with running energy cost and found stiffness was significantly related to the energy cost of running. In practice, that makes LSS a better indicator for efficiency than a purely derived efficiency label, and ILR a better indicator for leg loading than an indirect loading proxy. That does not make LSS a standalone economy score, but it makes it a stronger clue.
Stryd also uses a high-rate foot-mounted IMU; a sensors review describes the Stryd foot pod as a 6-axis IMU sampling at 1000 Hz, which helps capture stride events with more temporal detail than more indirect watch-derived signals. Those fields still need matched conditions and multiple runs.
Long distance versus fast distance: the metric emphasis changes
A long-run shoe and a 5K racing shoe do not have the same job. For longer distance, the comparison should care more about whether the shoe keeps the load on the legs lower at the same kind of effort. That means lower Stryd ILR when Stryd is available, or lower derived LPI when the comparison is Garmin-based.
For shorter and faster running, the efficiency side gets more important. In Garmin data that means duty factor and ground contact time become stronger signals. In Stryd data, LSS becomes a stronger efficiency clue for fast efforts. The ideal shoe for a race or workout is not only low-impact and not only springy. The best scenario is a shoe that shows the strongest efficiency clues and the lowest load on the legs, based on comparable metrics for that runner and purpose.
| Run purpose |
|
|
Practical shoe question |
|---|---|---|---|
| Easy and daily | Look for a controlled easy-pace pattern without giving away running efficiency. | Read load on the legs first, then use running efficiency as supporting context. | Does the shoe feel controlled without increasing load on the legs at easy pace? |
| Long run and marathon | Load on the legs matters more because repeated loading becomes more relevant. | Load on the legs matters most, while running efficiency still helps describe the shoe. | Does the shoe keep load on the legs lower as distance grows? |
| Tempo, 5K, and 10K | Running efficiency carries more of the read. | Running efficiency becomes more important for fast efforts. | Does the shoe help you move quickly without a harsh load-on-the-legs tradeoff? |
What the data supports, and what it does not
A 2024 systematic review supports a careful interpretation: ground contact time and duty factor were not simple universal economy markers when speed was standardized. That means lower contact time can be useful in your own matched shoe comparison, but it should not be sold as automatically better for every runner.
The same nuance applies to impact loading. Higher loading rate is often discussed in injury-risk conversations, but a systematic review on running biomechanics and injury evidence cautions that prospective findings are mixed and injury risk is not one metric. For shoe comparison, the more useful framing is performance durability: if a shoe shows higher load on the legs at the same pace, it may become a fatigue-cost signal during longer efforts. A systematic review on running-induced fatigue and impact loading found moderate evidence that leg stiffness decreases with fatigue and noted performance implications because leg stiffness and running economy are linked. Run-It therefore uses ILR and LPI as loading-context signals for shoe choice, especially for longer runs, not as injury predictions.
How Run-It applies it
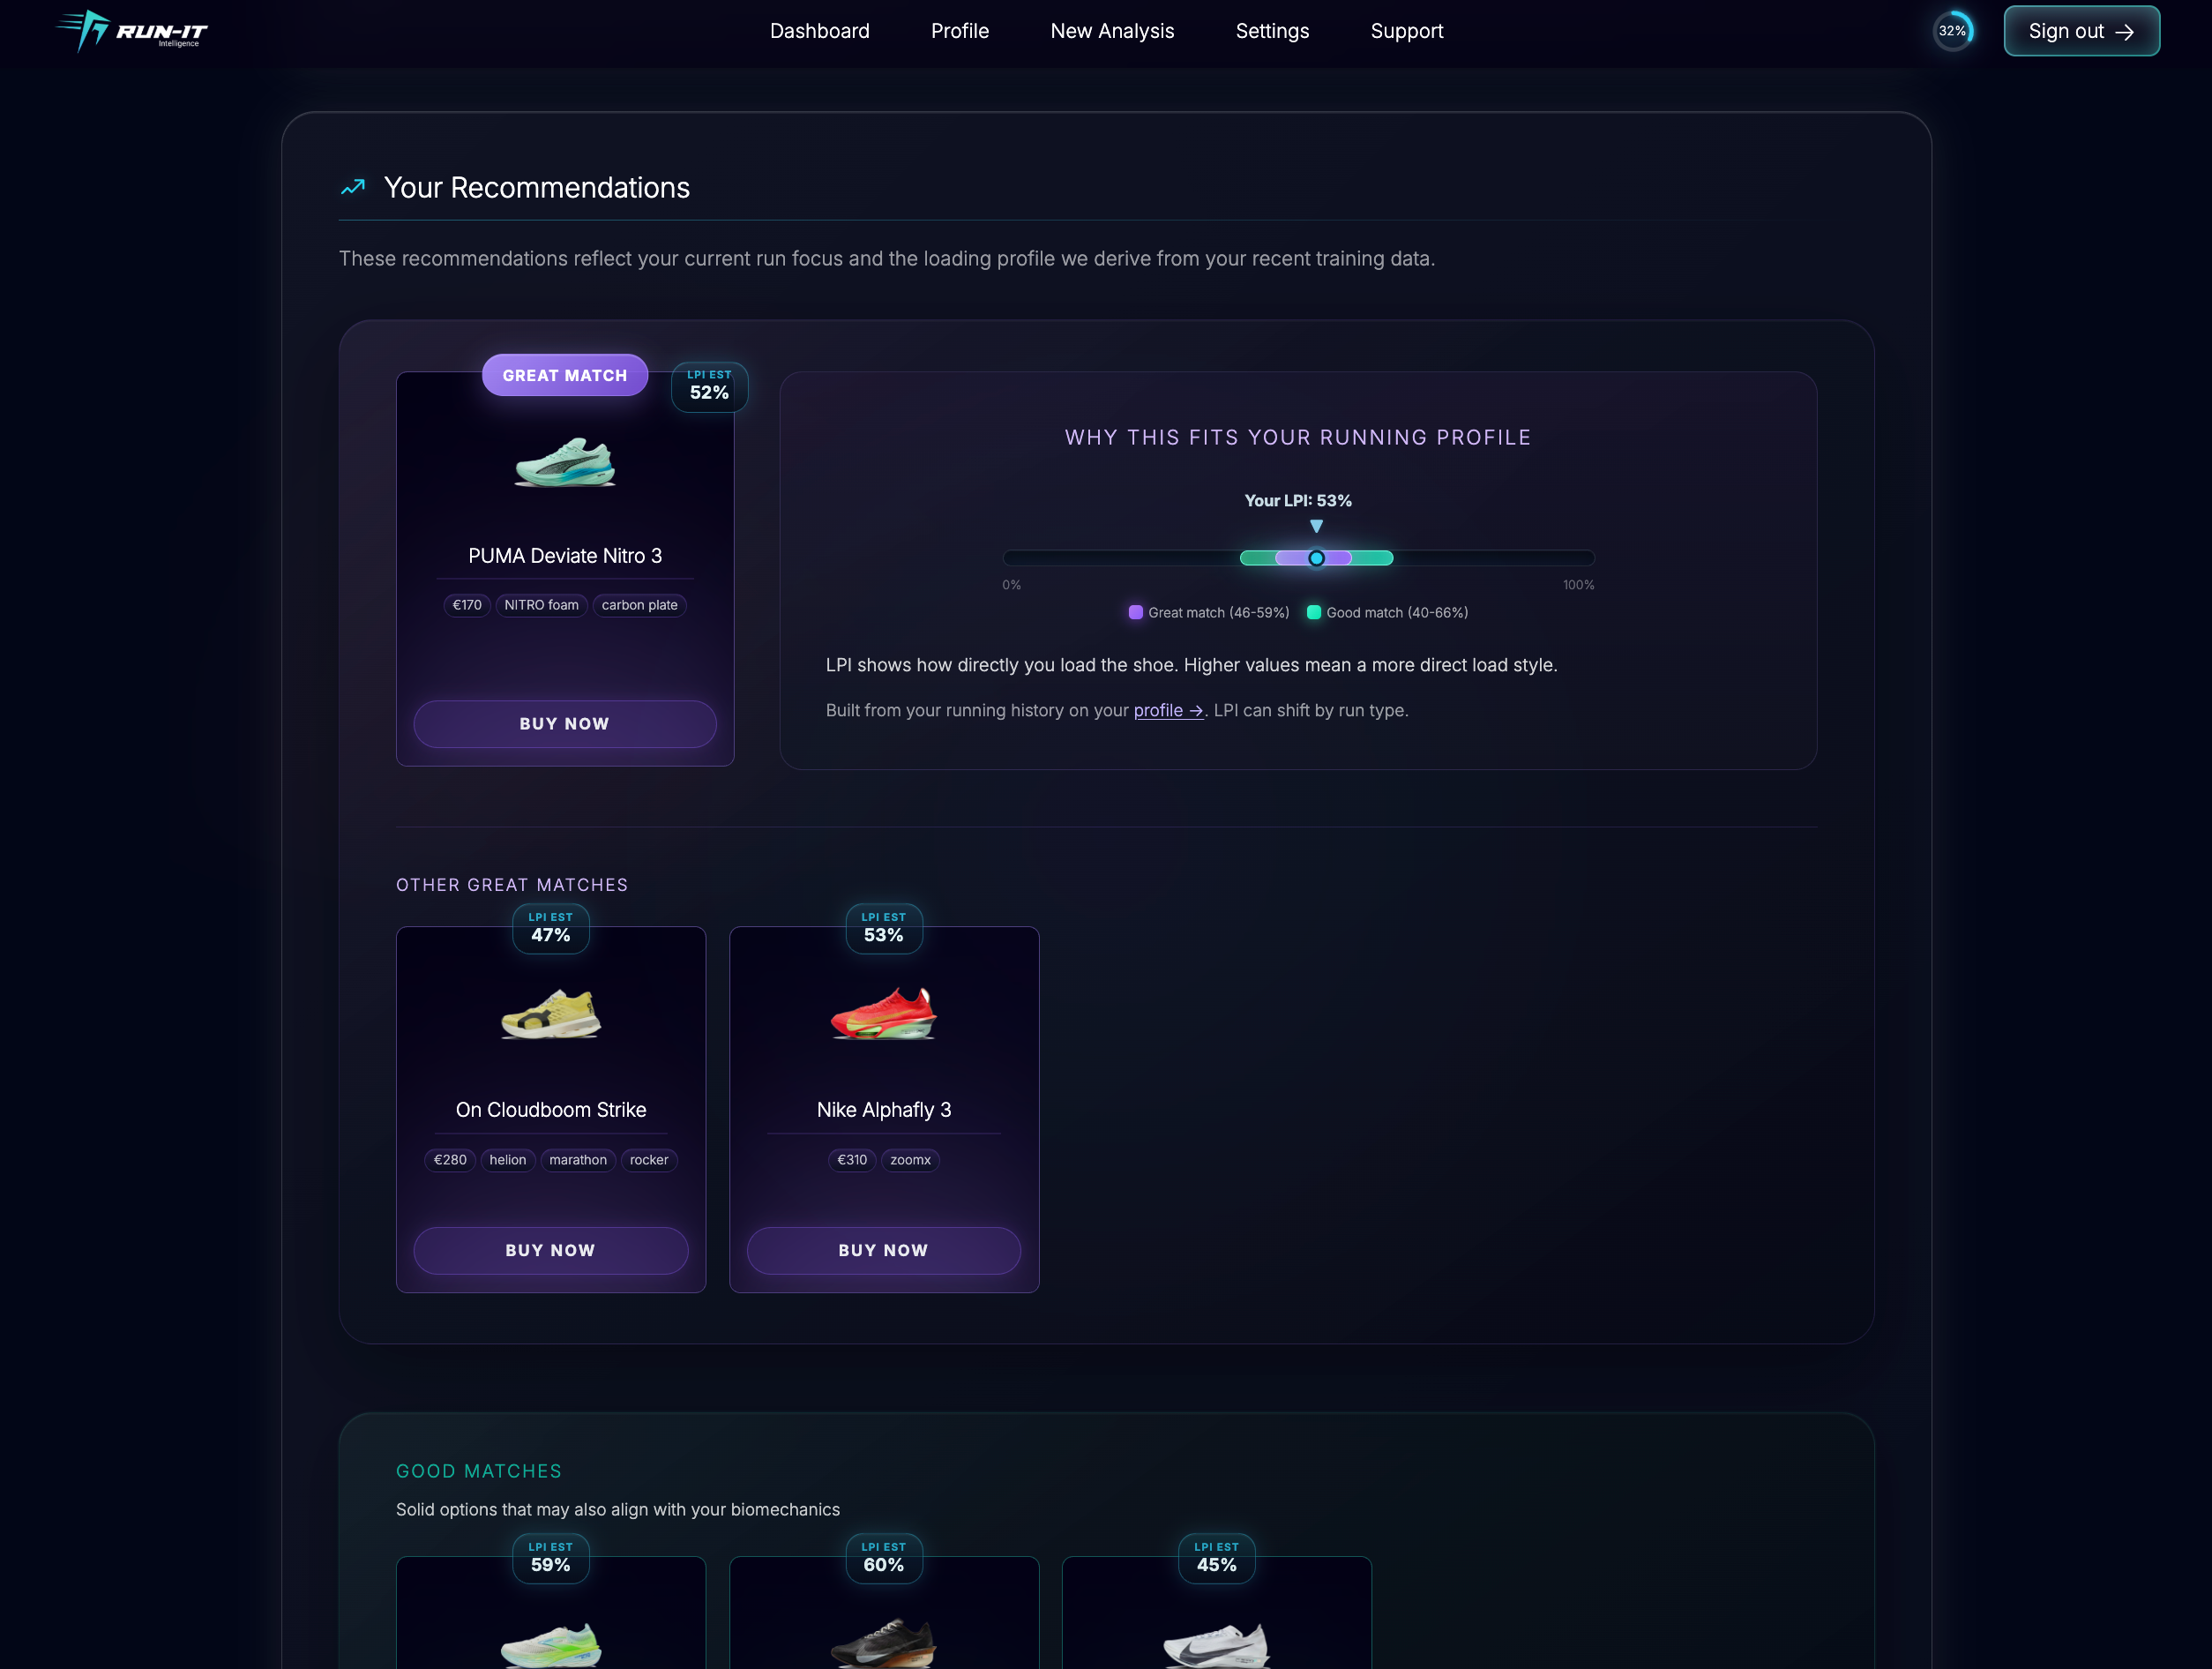
Run-It keeps the Garmin-versus-Stryd difference intact instead of pretending the two data streams are the same. Garmin-style comparisons use repeated patterns from GCT, duty factor, vertical ratio, and derived LPI. Stryd-style comparisons add direct ILR and LSS when those fields are available. Each activity is then split into a fresh window and a fatigue or end window: the fresh window is the cleaner baseline, while the later window checks whether contact time, loading, heart-rate drift, and mechanics change after pace is accounted for.
The shoe tool applies that logic inside your owned rotation. Filter by Garmin or Stryd, effort, distance, confidence, and visible shoes, then read each card by purpose instead of treating every shoe as competing for the same job. Long and marathon contexts are more loading-aware; shorter race contexts are more efficiency-aware.

A simple protocol for comparing your shoes
Match the run type. Compare easy shoes on easy runs, long-run shoes on long runs, and race shoes on faster efforts.
Keep the conditions close. Same route, similar surface, similar grade, and similar effort make the comparison cleaner.
Read efficiency, loading, and HR drift together. Look for lower duty factor or GCT, higher LSS when relevant, lower ILR or LPI, and steadier HR drift on comparable runs.
Keep comfort in the loop. Metrics help narrow the decision, but comfort, fit, terrain, and how your legs feel after the run still matter.
FAQ
Can Garmin data compare running shoes?
Yes, Garmin running dynamics can support shoe comparison when the runs are matched by pace, surface, grade, fatigue level, and sensor setup. Ground contact time, duty factor, vertical ratio, and derived Loading Pattern Index are repeated comparison signals, not a one-run shoe verdict.
Why is Stryd more complete than Garmin for shoe comparison?
Stryd can provide leg spring stiffness and impact loading rate in addition to running dynamics. That gives a more direct read on spring-mass efficiency and initial loading than Garmin-only data can provide.
Is lower ground contact time always better?
No. Ground contact time changes with speed, cadence, surface, fatigue, and runner style. It is useful as a matched-run trend, especially for faster shoe comparisons, but it is not a universal target.
Should I pick the shoe with the lowest ILR?
Not automatically. Lower ILR can be useful for longer runs because it suggests a softer loading pattern, but the shoe still needs to fit the run purpose, pace, comfort, and your own repeated trend.
How many runs do I need to compare shoes?
One clean back-to-back test is useful if you run both shoes directly after each other on the same route at similar effort, with a short recovery break. That keeps route, weather, air power, and pacing closer. For the overall best shoe, use multiple comparable runs per shoe whenever possible, because repeated runs show your normal pattern and how each shoe behaves as fatigue builds.
Sources
- Garmin Running Dynamics definitions for cadence, ground contact time, stride length, vertical oscillation, and vertical ratio.
- Stryd Metrics help article for Air Power, ground contact time, duty factor, leg spring stiffness, and impact loading rate.
- Imbach et al. validation study on Stryd running power, ground contact time, and leg spring stiffness.
- Barnes and Kilding review on running economy measurement, oxygen cost, and multifactorial physiological efficiency.
- Van Hooren et al. systematic review and meta-analysis on running biomechanics and running economy.
- Lussiana et al. on duty factor and running economy, including why less ground time is not always better.
- Wingo et al. review on cardiovascular drift, heart-rate rise, and heat-stress implications during exercise.
- Darch et al. systematic review and meta-analysis on running-induced fatigue and impact loading.
- Dalleau et al. on leg-spring characteristics and aerobic demand during running.
- Cerezuela-Espejo et al. scoping review on running power sensors, including Stryd IMU sampling and wearable power evidence.
- Peterson et al. systematic review on running biomechanics and injury evidence.
- Xu et al. systematic review and meta-analysis on footwear and running economy.