

Quick answer
To train your running form, compare yourself at the same pace, work on one factor at a time and check again after a few weeks of similar runs. Run-It's Running Form Score makes that loop practical. It gives your easy runs, tempo runs and race pace their own score out of 100, built from your Garmin or Stryd running dynamics. Each score shows which factor costs you the most points, and compare mode shows whether that factor moved. The scores are directional, model-based guidance. They do not diagnose anything or predict injury.
Why running form is hard to train
Most runners who try to improve their form hit the same wall. The watch records ground contact time, vertical ratio and a dozen other fields, then leaves you to work out which number matters for the run you just did and what a sensible value looks like at your pace.
The research adds a second problem. A 2024 meta-analysis of observational studies found that individual biomechanics measures explain only about 4 to 12 percent of the differences in running economy between runners when each is looked at on its own. Ground contact time and duty factor showed trivial links by themselves, while cadence, vertical movement and leg stiffness showed small to moderate ones. Chasing one number is a weak training plan.
So we built a score that does the reading for you. It sorts your runs by pace, checks each factor against a target that suits that pace and type of run, and turns the result into one number per type of run.
What is a running form score?
A running form score is a single number that summarises how your running mechanics compare with a target for your pace and type of run. Run-It's Running Form Score runs from 0 to 100 and is calculated separately for easy runs, tempo runs and race pace. It is built from Garmin or Stryd running dynamics and is meant as directional guidance, not a validated scientific measurement.
Why running form has to be judged by pace
Your form changes when your pace changes, even when nothing is wrong. Speed up and each foot spends less time on the ground while your stride gets longer. Slow down and the opposite happens. Put an easy run at 6:00 per kilometre next to a set of 4:00 intervals and the easy run will usually look worse on paper, because it is a different movement.
That is why Run-It sorts your runs by pace before it scores anything. Your Biomechanical Signature places every run in narrow pace brackets and groups those brackets into three zones: easy runs at your slower paces, tempo runs in the middle and race pace at the fast end. Each score only compares like with like.
What the Running Form Score measures
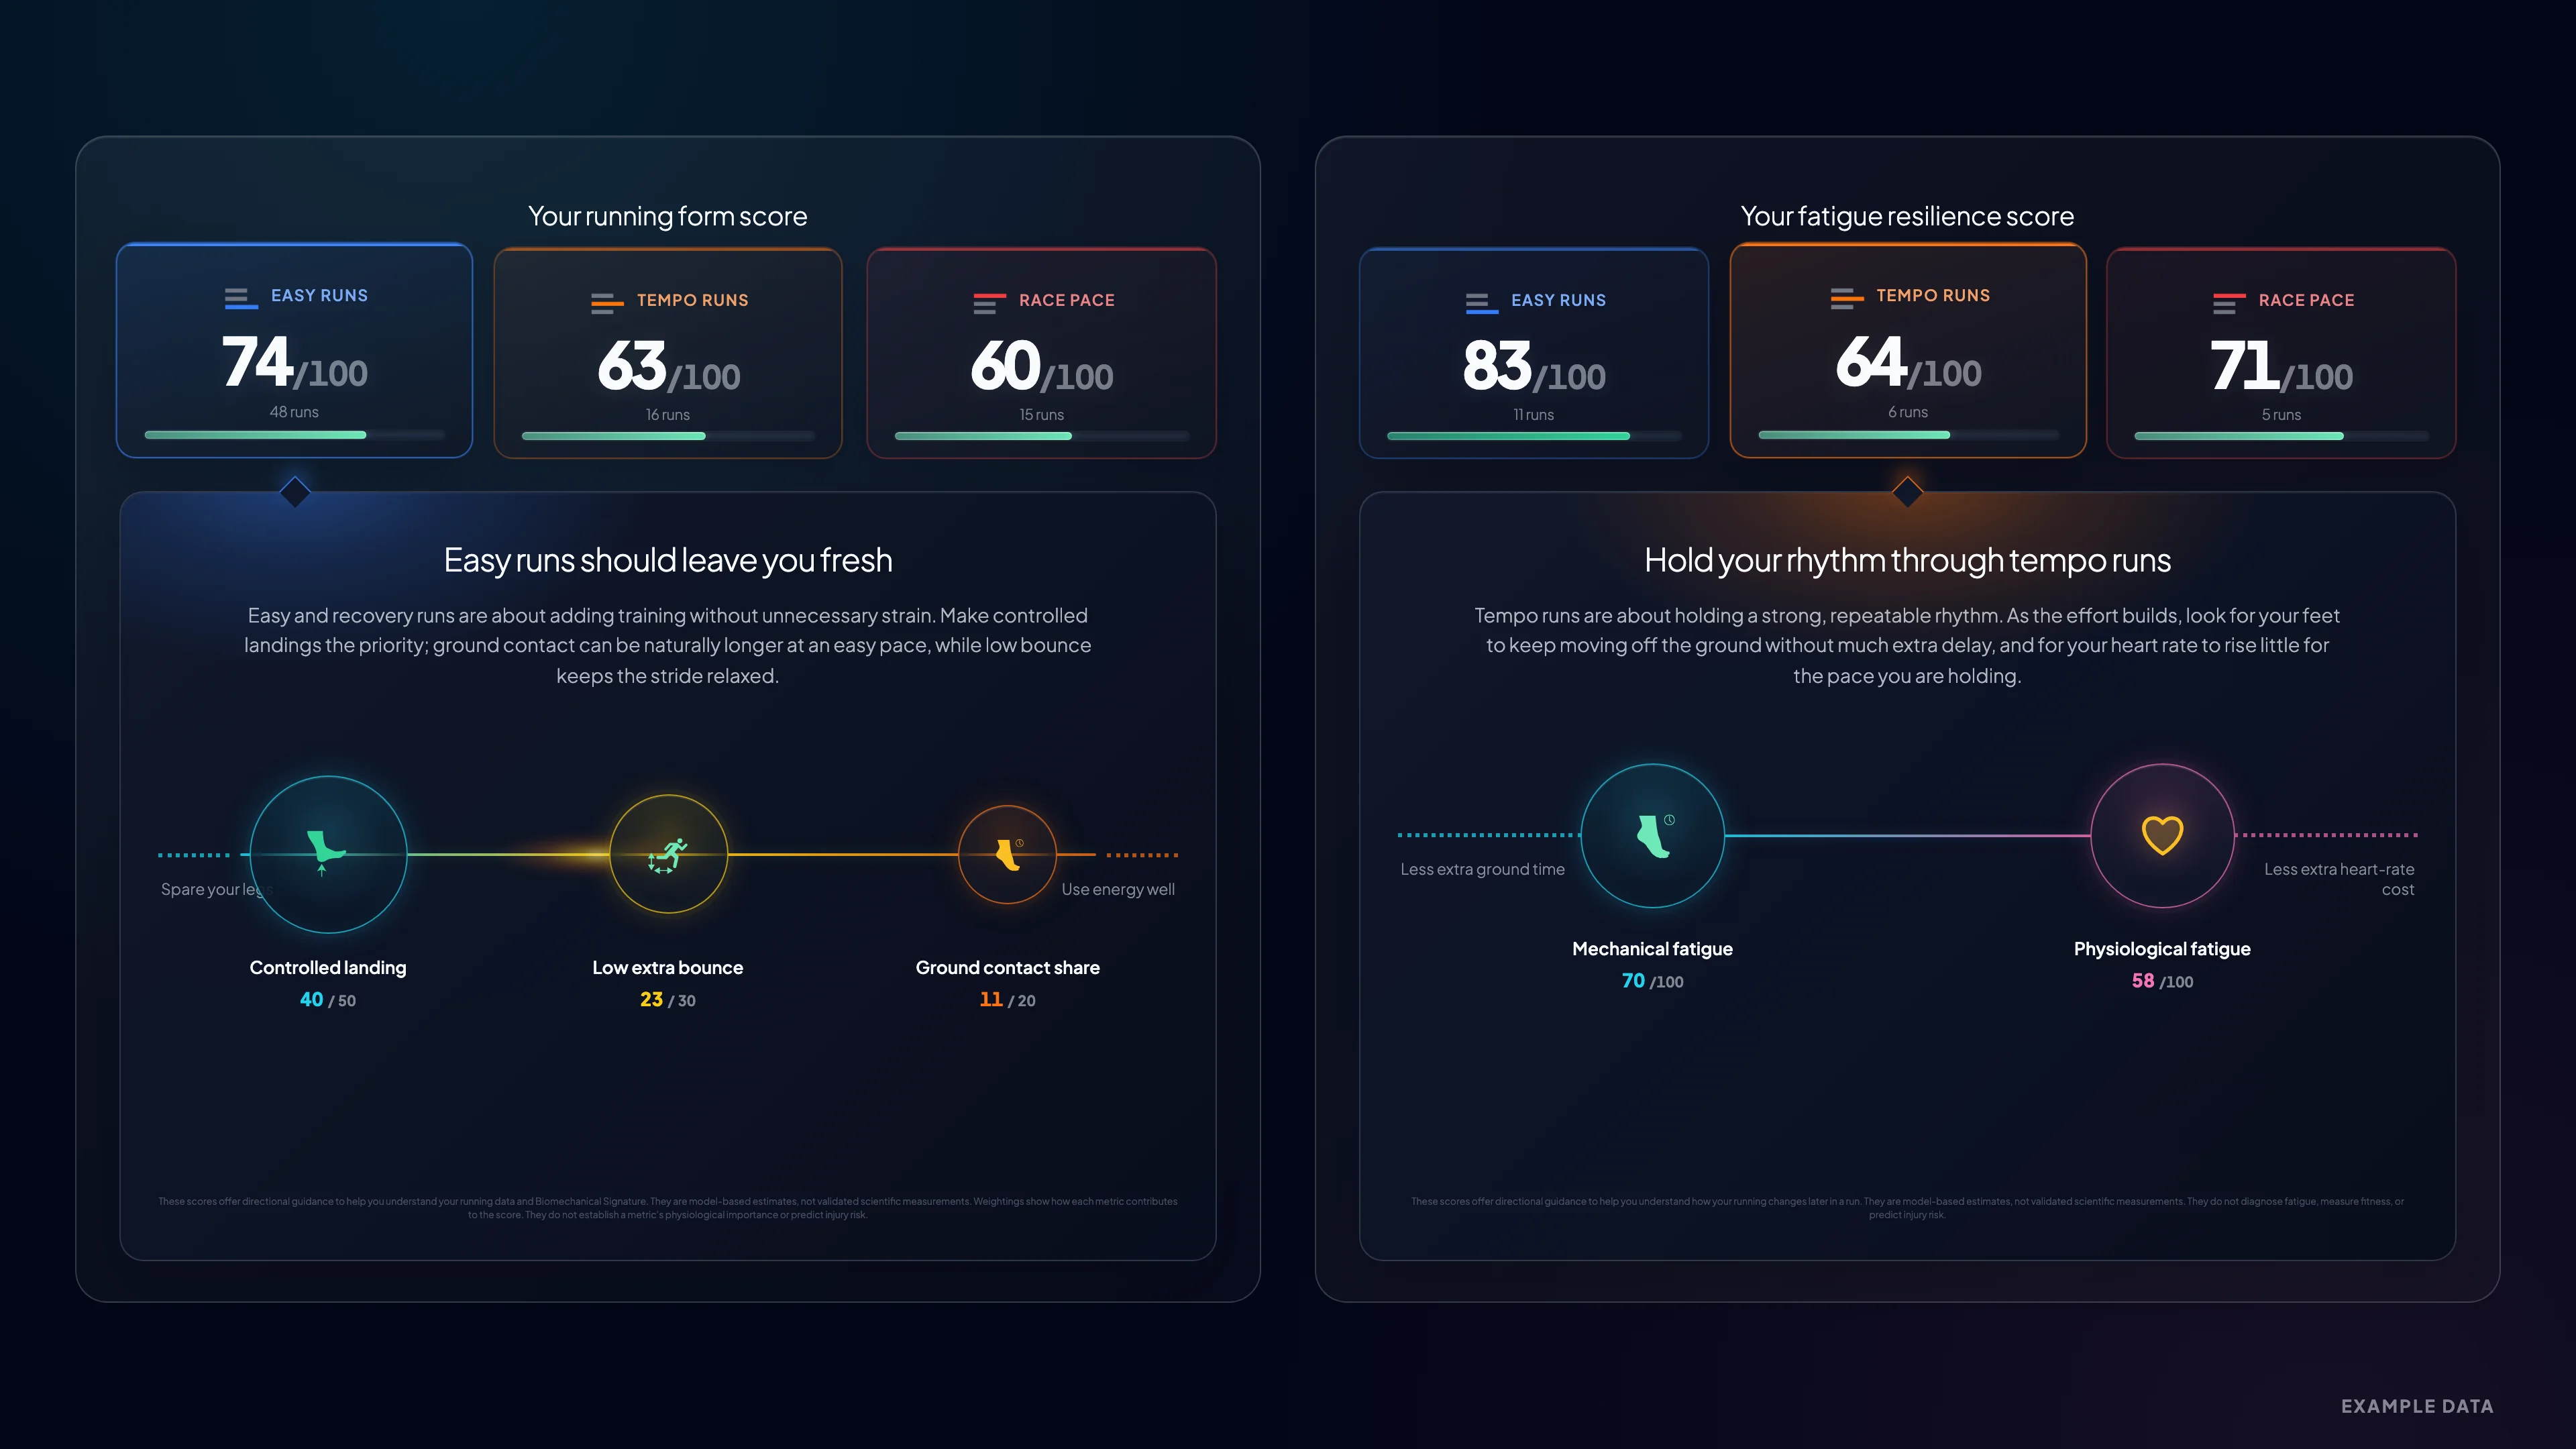
Open My Runs and go to your Biomechanical Signature. Above the chart you will find three cards: race pace, tempo runs and easy runs. Each one shows a score out of 100 for the runs in that pace zone. Your Total Running Score, the average of the three, sits with your Key Influencing Metrics.
Every score is built from three factors, and the card gives each one a plain name. On Garmin runs, Loading Pattern Index (LPI) appears as Controlled landing, Duty Factor as Ground contact share and Vertical Ratio as Low extra bounce. On Stryd runs, Impact Loading Rate appears as Controlled loading, Leg Spring Stiffness as Useful leg spring and Vertical Ratio again as Low extra bounce. Heart rate is not part of this score.
Tap a card and its factors appear as circles. A bigger circle means that factor counts for more in that type of run, and the points underneath show what you earned out of what was available. The factor with the widest gap between those two numbers is usually where your training attention belongs.
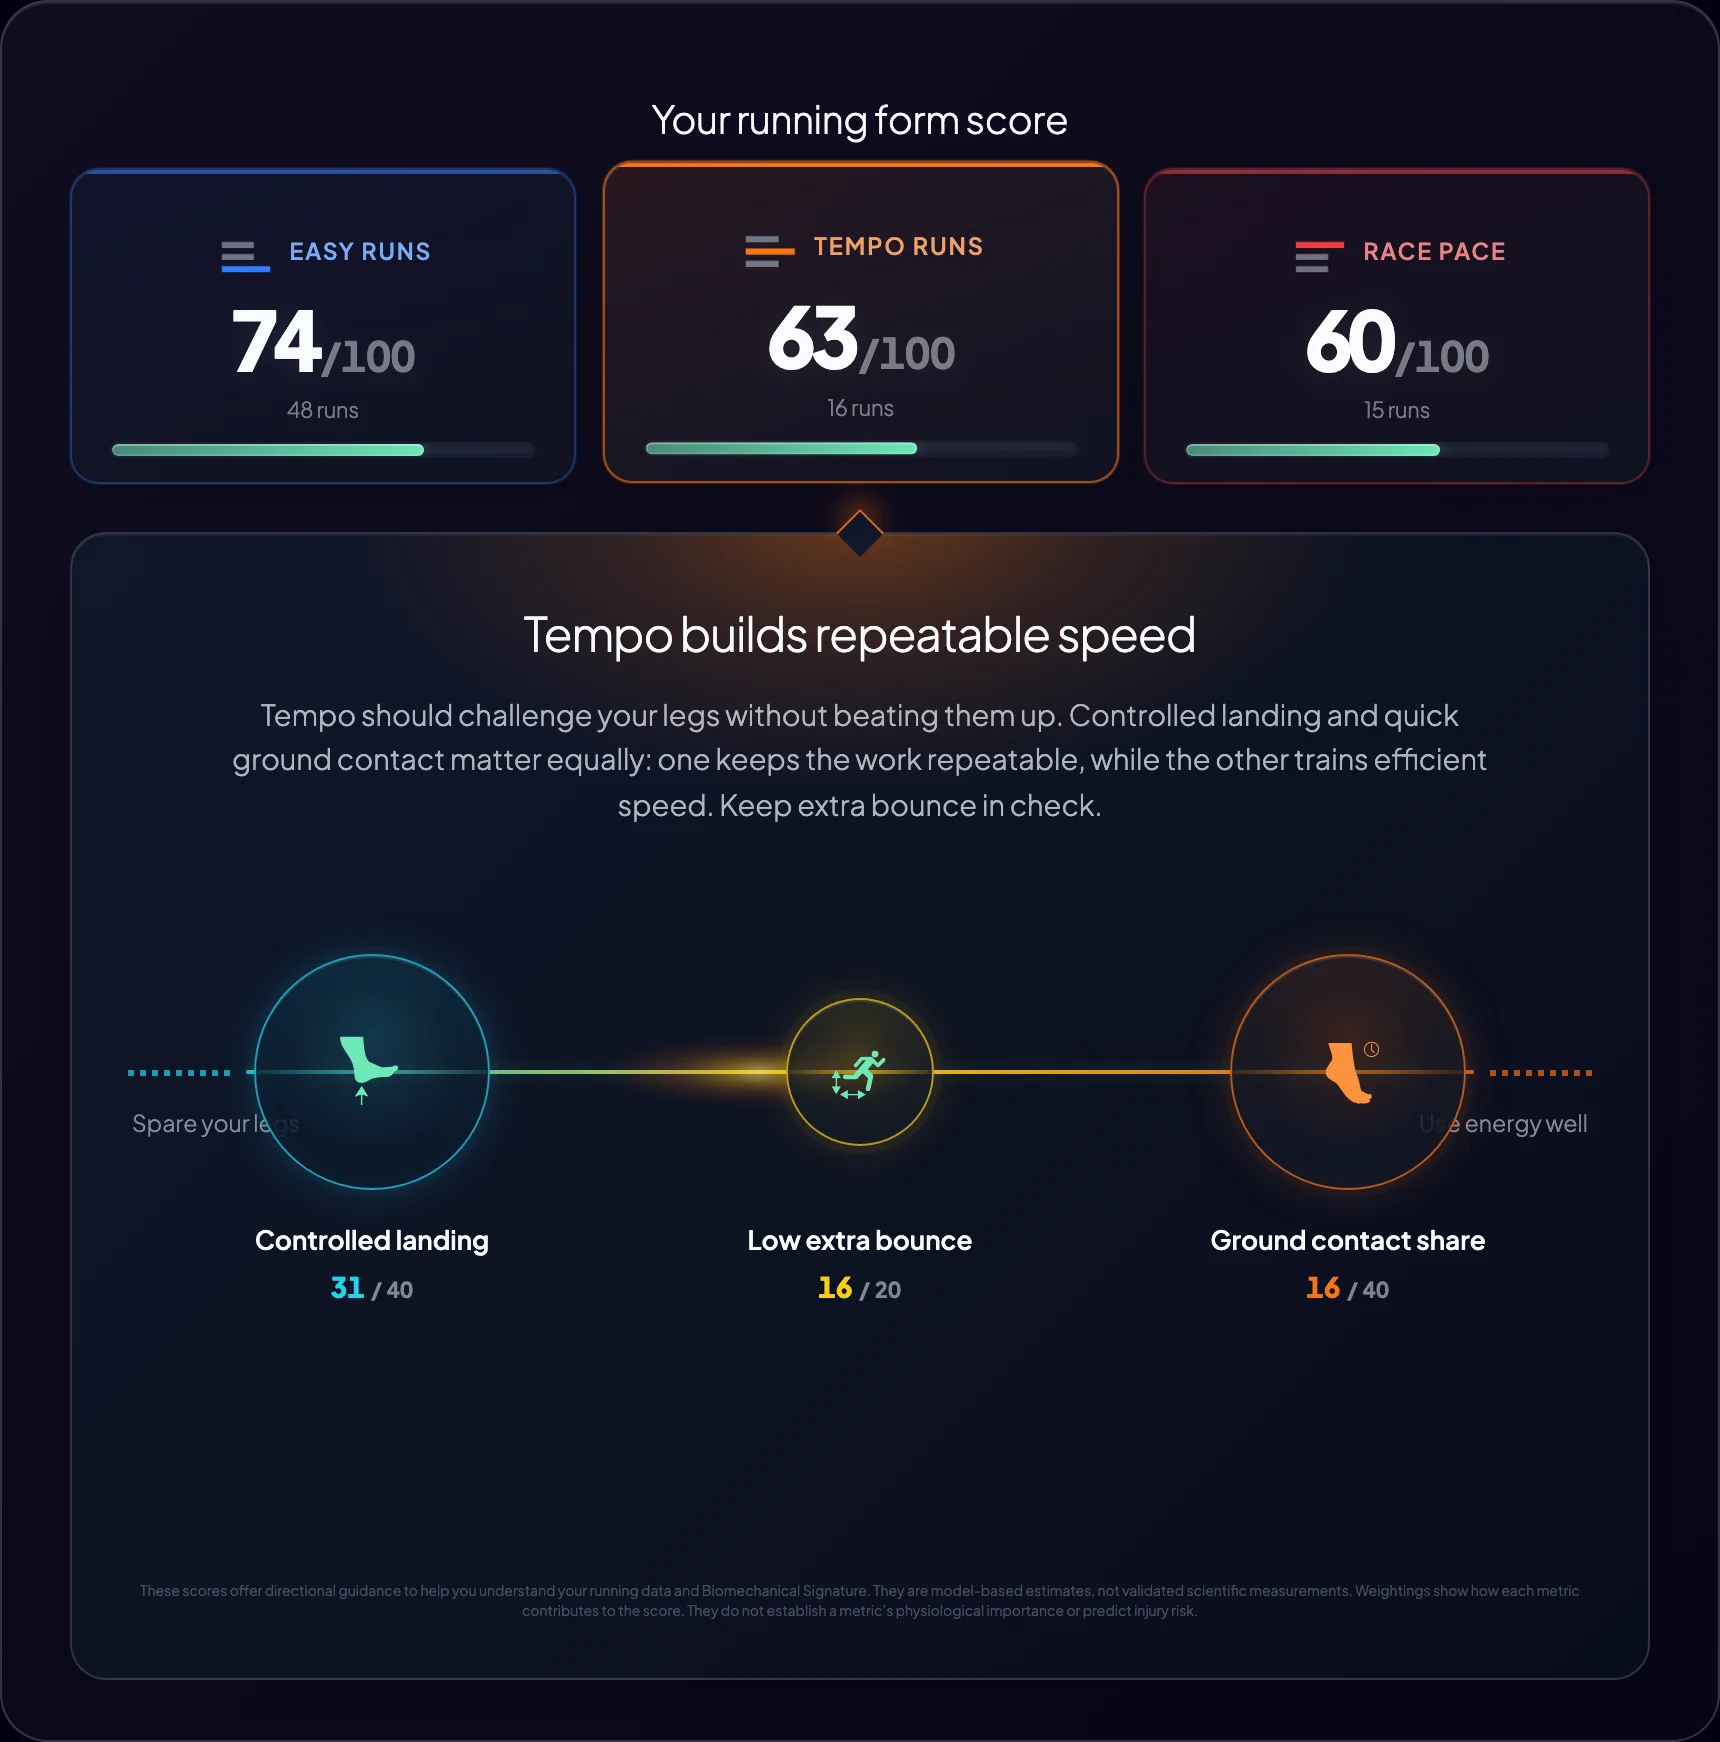
Each type of run asks for something different, so the factors are weighted differently.
On easy runs, Loading Pattern Index counts most, because easy mileage should add training without unnecessary strain. On tempo runs, loading and Duty Factor count equally. At race pace, the balance shifts with the race distance you are training for.
The metrics behind the score, in plain words
These are the biomechanics terms the score translates for you. You do not need to memorise them, but knowing what each one describes makes the score much easier to act on.
| Metric | On the card | What it describes | What the score looks for |
|---|---|---|---|
| Loading Pattern Index (LPI) | Controlled landing | Run-It's estimate of how heavily each step loads for the pace, combined from several running metrics. Garmin runs. | A lighter, controlled pattern on easy runs, and loading that stays controlled as the pace rises. |
| Duty Factor | Ground contact share | The share of each full stride that a foot spends on the ground. It shifts with pace. Garmin runs. | A value close to the target for your pace. Less time on the ground is not automatically better. |
| Vertical Ratio | Low extra bounce | How much you move up compared with how far you travel forward. Garmin and Stryd runs. | Some bounce is normal on easy runs. At tempo and race pace, extra bounce should stay under control. |
| Impact Loading Rate | Controlled loading | How quickly force builds when your foot lands. Stryd runs. | A gentler build on easy runs, and loading that stays controlled for faster efforts. |
| Leg Spring Stiffness | Useful leg spring | How strongly your leg stores and returns energy with each step. Stryd runs. | Enough spring for the pace you are running. More is not always better. |
Two details are worth knowing. Garmin's own manual says a lower vertical ratio usually indicates better form. Run-It scores it against a target for the type of run instead, so a relaxed easy run is not marked down for a little bounce.
Duty Factor works the same way. In a study of 23 slow recreational runners, duty factor ranged from about 42 to 56 percent, and runners who spent a larger share of each stride on the ground had lower peak vertical and braking forces. At easy paces, a little more ground time can be the calmer pattern.
How to use the score to train your running form
Treat the score as a feedback loop. It works best when you change one thing, keep your paces comparable and look again.
Pick the type of run you care about. Start with easy runs if most of your mileage is easy, or race pace if a goal race is coming up. Scores are only comparable within the same type of run.
Find the factor with the widest gap. Open the card and compare the points each circle earned with the points it could earn. Start with the widest gap on a big circle.
Change one habit for a few weeks. Keep your usual paces and adjust a single thing, for example a slightly quicker cadence. Changing several things at once makes the result impossible to read.
Check the same card again. Once you have more runs in that zone, use compare mode to set the new period against the old one and see whether the factor earned more points.
Inspect the details when a number surprises you. Your Biomechanical Signature shows the underlying metrics for the selected pace zone, so you can see which runs moved the score.
Cadence is a sensible first experiment because it has been studied more than most form cues. In a treadmill study of 45 recreational runners, raising step rate by 5 to 10 percent at the same speed reduced the up and down movement of the body and the braking impulse, and less energy was absorbed at the knee. Cadence also showed a small positive link with running economy in the 2024 meta-analysis.
Make any change gradually. If a new habit comes with pain, stop and talk to a physiotherapist or coach before you push on.
See whether your running form score goes up
Scores move as new runs come in, so the most useful habit is simply to come back. Set compare mode to the weeks before you changed something and the weeks after. The comparison cards and your Total Running Score show both periods, and each circle shows its points for both.
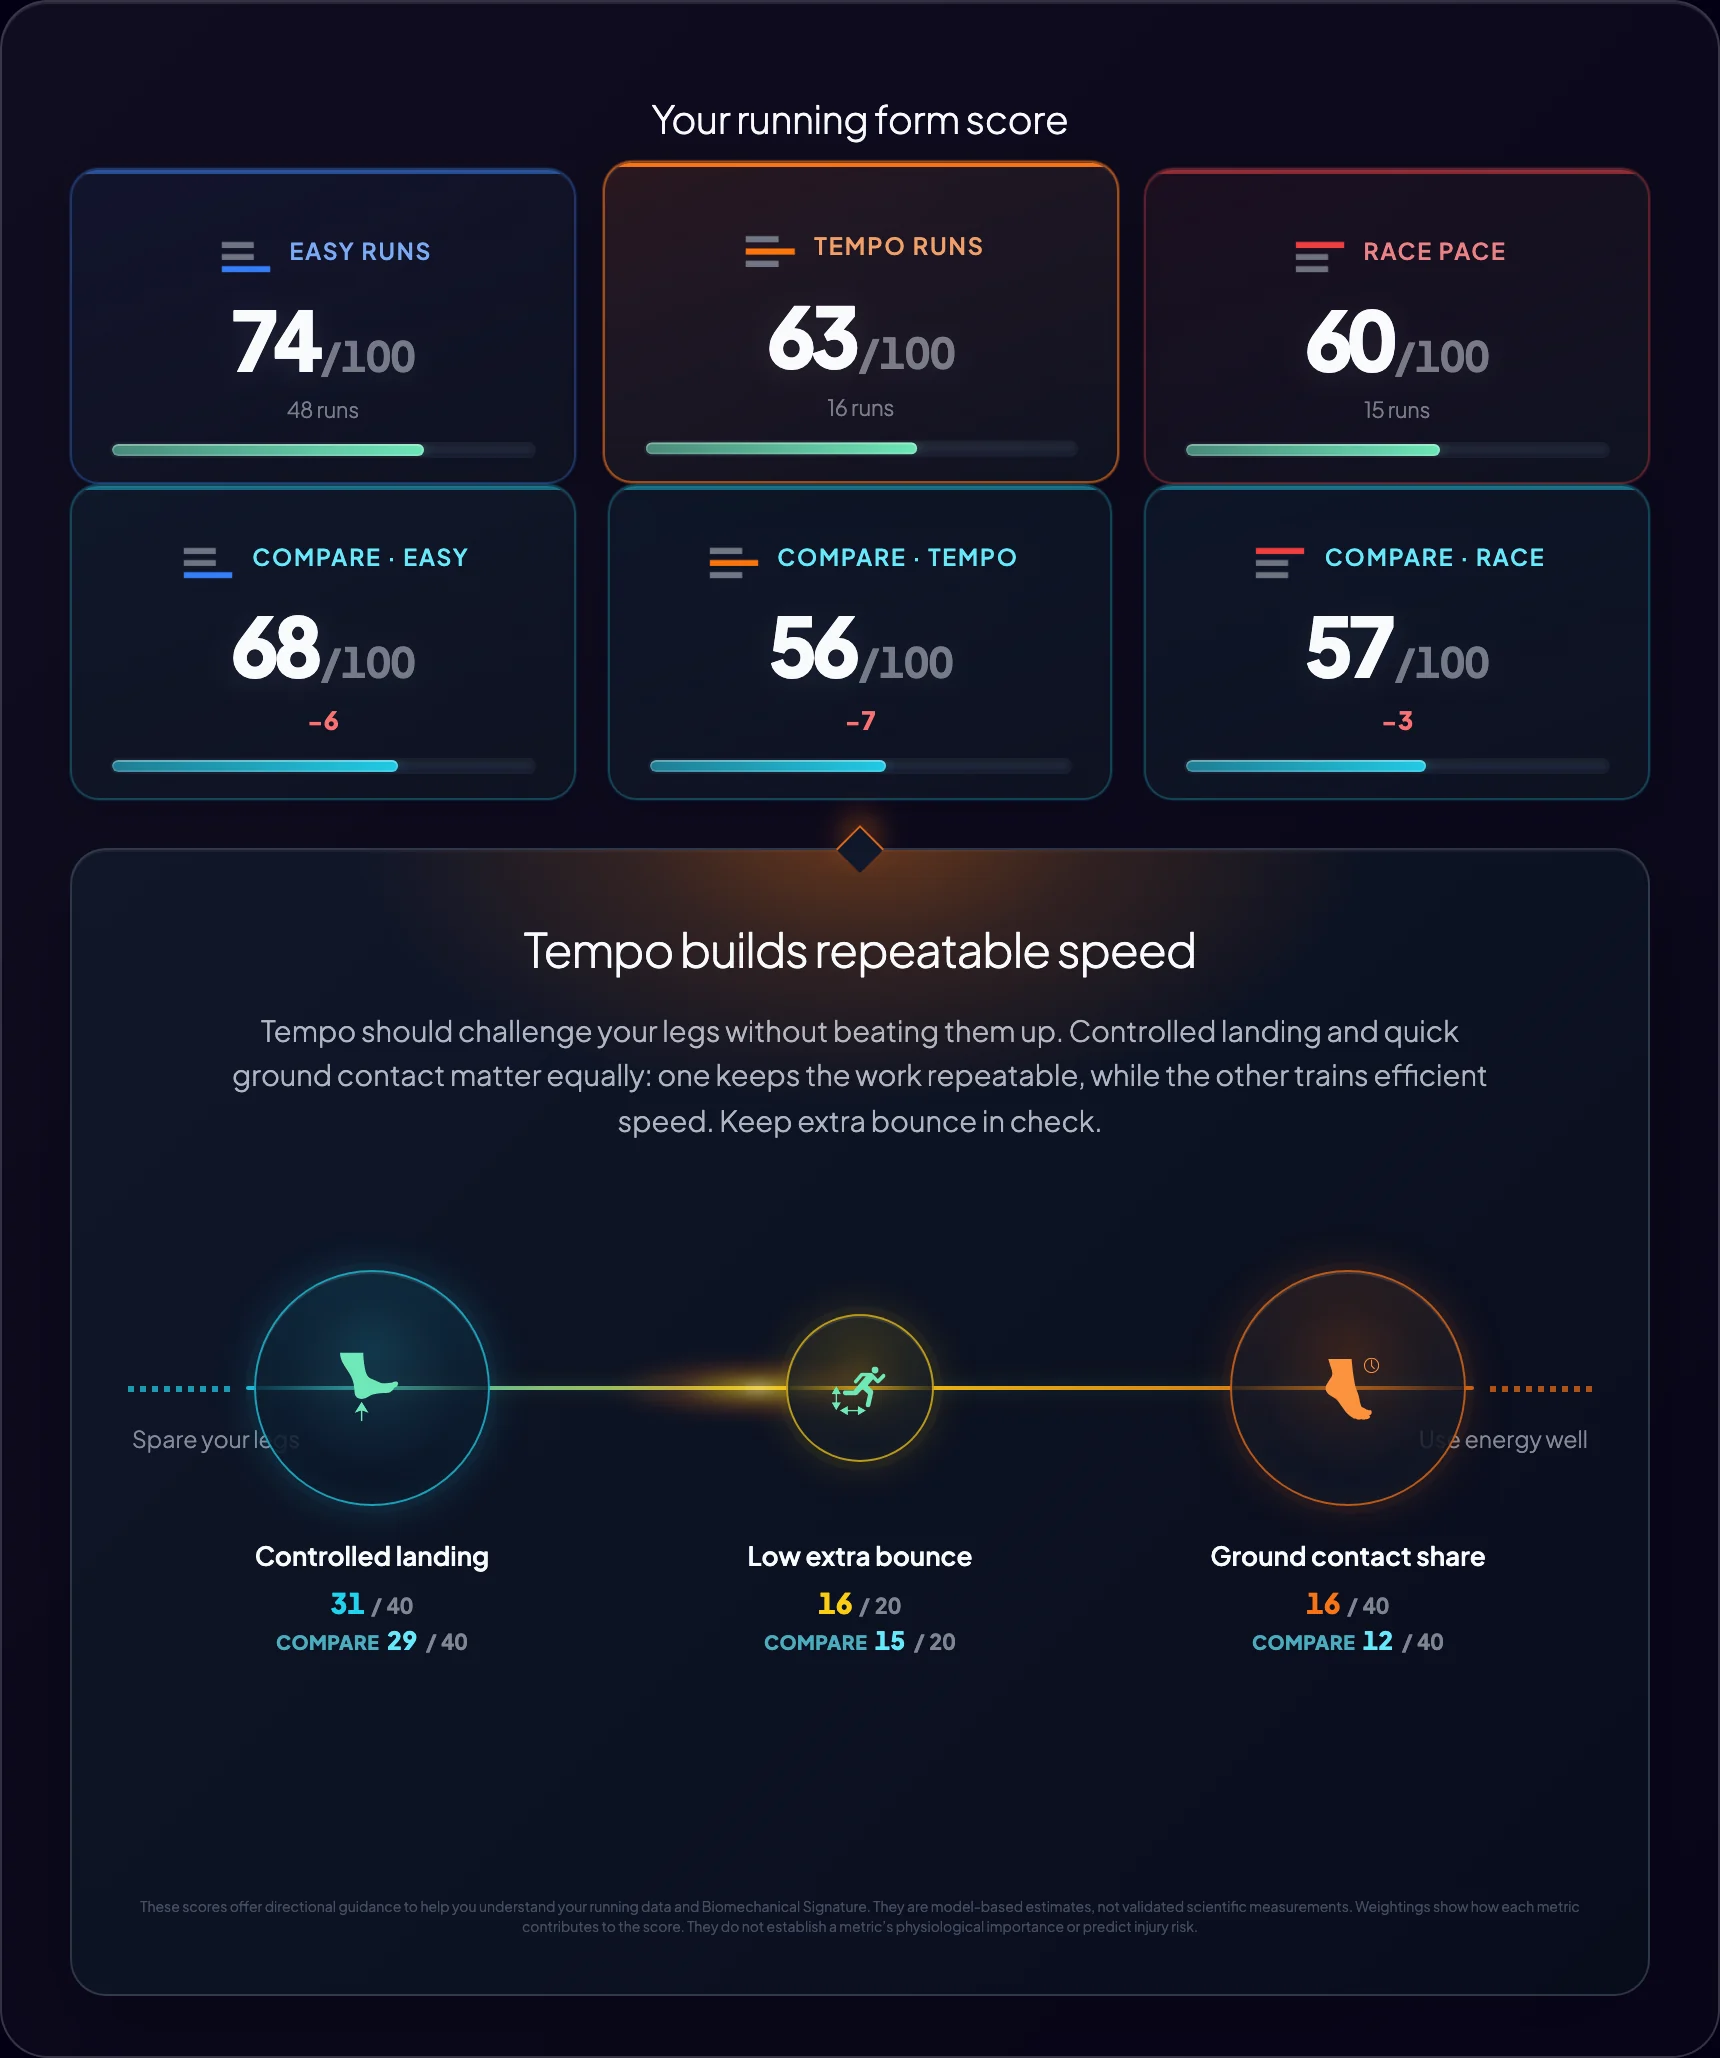
Give it runs and give it time. A card that rests on a handful of runs can swing from one week to the next, and each card shows how many runs sit behind it. The shoe filter matters too: the same weeks can score differently in a race shoe and in your daily trainer.
Fatigue Resilience Score: does your form hold up late in a run?
The Running Form Score looks at how you run. The Fatigue Resilience Score looks at how well that holds up as a run goes on. It uses the same three cards for race pace, tempo runs and easy runs, and each gets a score out of 100.
For each comparable run, Run-It checks two things between an early and a late stretch, allowing for changes in pace. Mechanical fatigue asks whether you spend extra time on the ground towards the finish. Physiological fatigue asks whether the same pace needs more heart-rate effort later on. The early window starts at or after 10 minutes, so a slow warm-up does not count against you. Small late-run increases keep both factors close to 100.
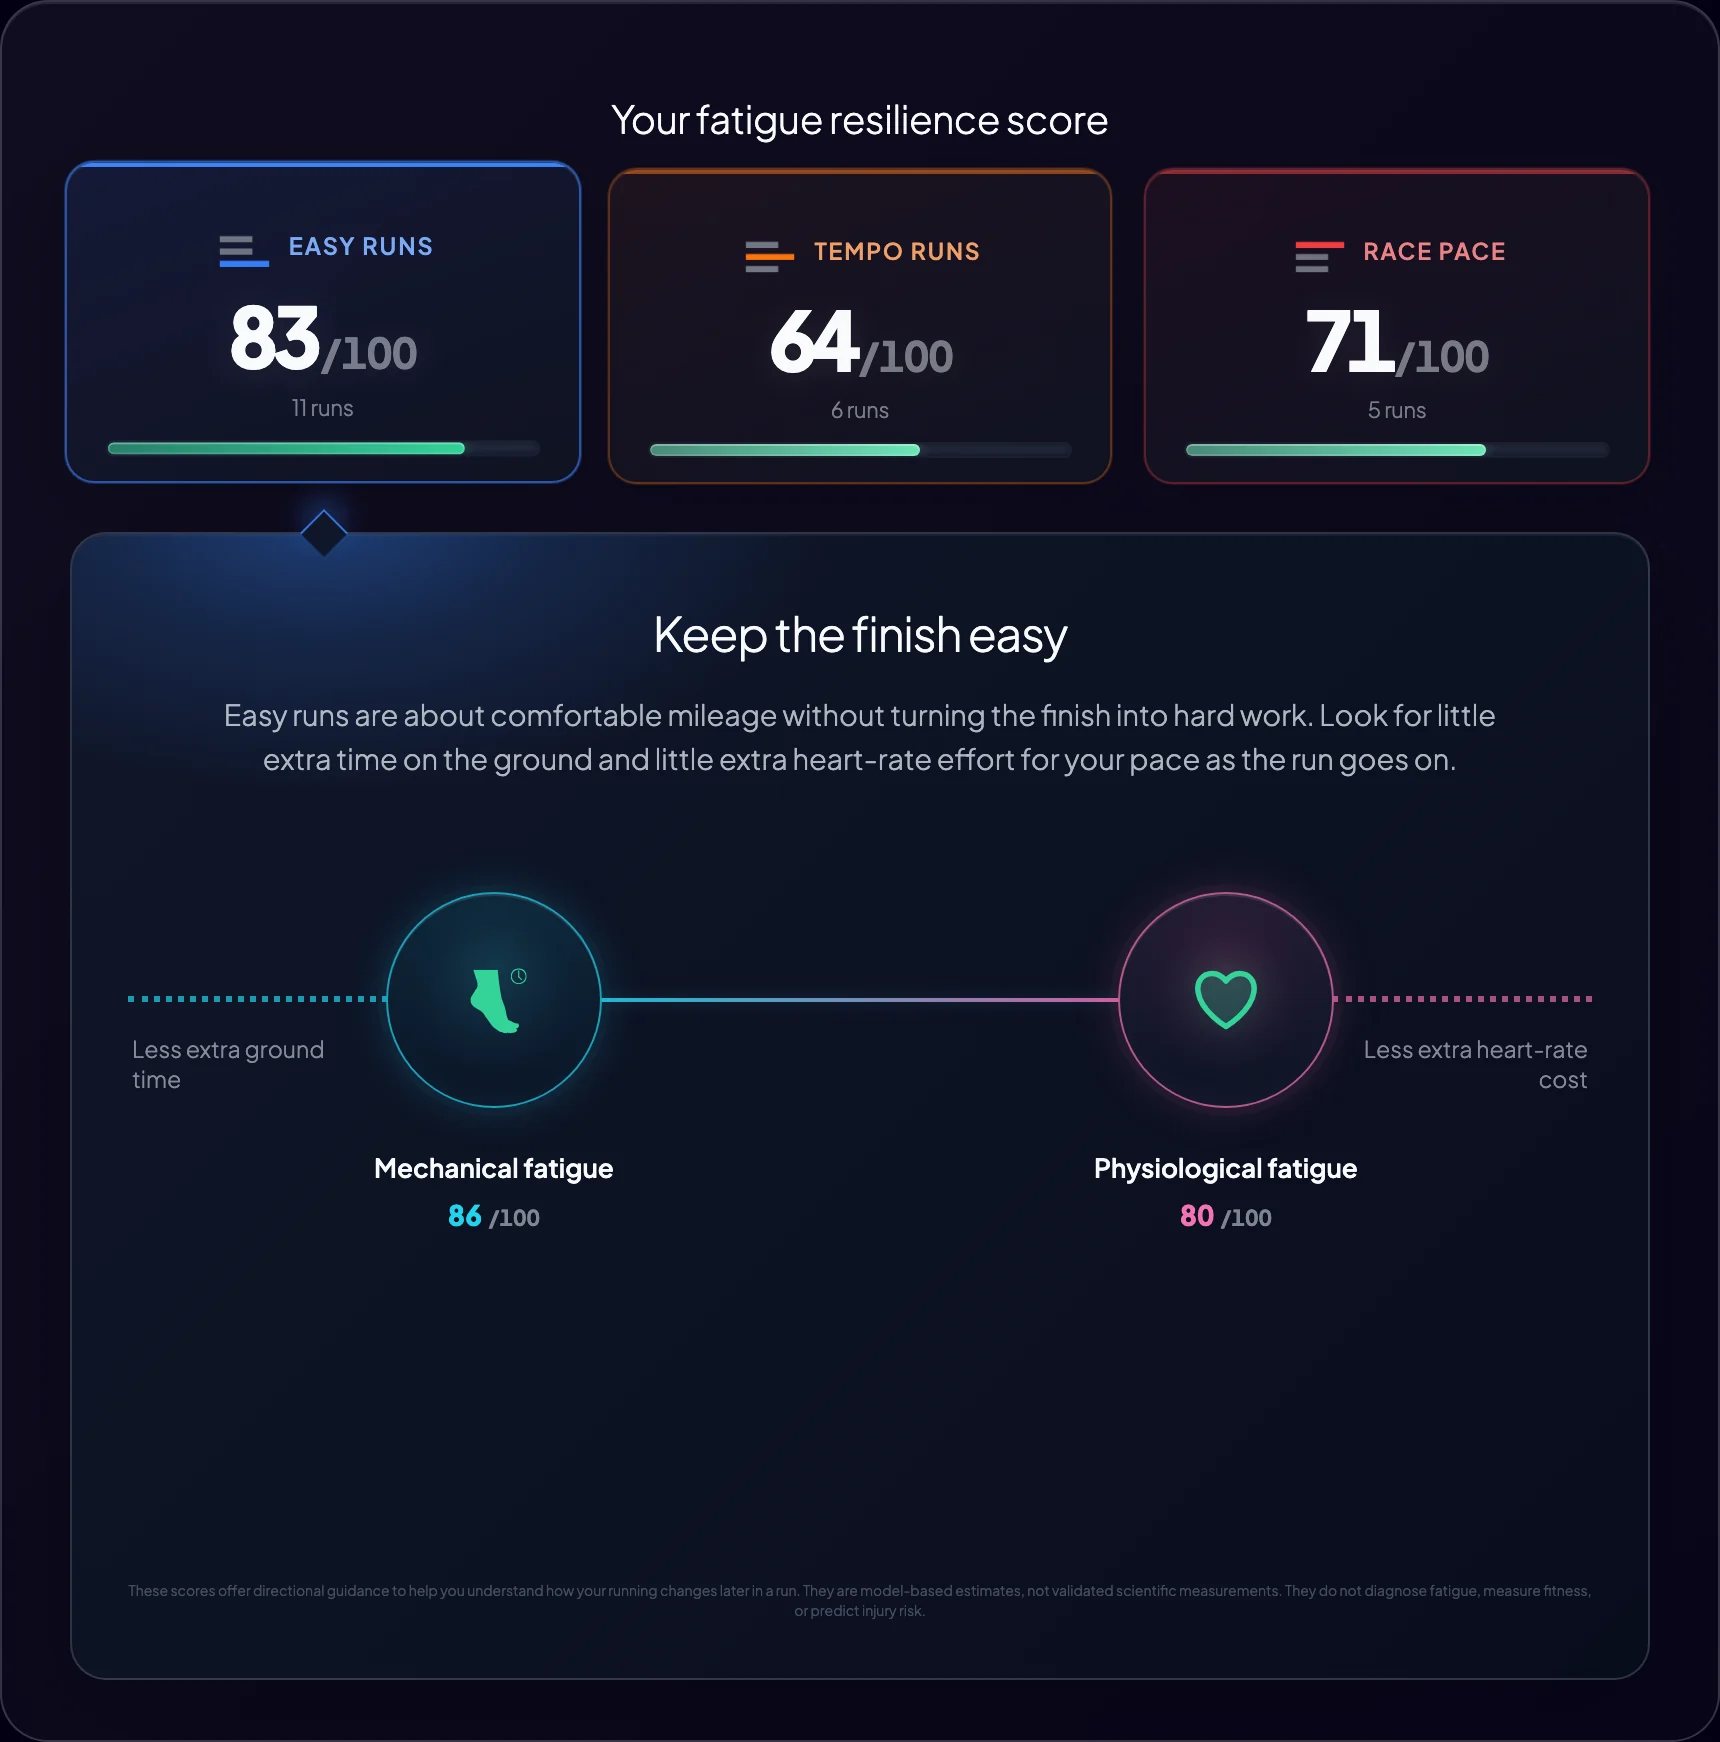
Both checks have support outside Run-It. A systematic review and meta-analysis of 16 overground running studies found strong evidence that ground contact time gets longer with fatigue when running speed stays the same. For heart rate, coaches use a related idea called aerobic decoupling, and TrainingPeaks guidance treats decoupling of 5 percent or less on steady aerobic sessions as a sign of sound aerobic endurance.
Only runs with medium or high data quality count, and each card shows how many of those runs it rests on. Below the cards, the fatigue grid lets you open any run in Drift Inspector to see where in that run the change appeared.
Directional guidance, not a diagnosis
Both scores are model-based estimates. The weighting by type of run is there to make the numbers readable and describes how each score is built. It does not mean one metric matters more to your body than another. Neither score diagnoses fatigue, measures fitness or predicts injury risk.
Use the scores to decide what to look at and to see whether a change is showing up in your runs. If a score drops alongside pain, talk to a physiotherapist or coach.
What you need to use the scores
Both scores work with Garmin runs that include Running Dynamics and with Stryd runs. Some Garmin watches record Running Dynamics from the wrist, while other models need an accessory such as HRM-Pro or the Running Dynamics Pod. The scores for easy runs, tempo runs and race pace are free, and so is your Total Running Score. Filtering race pace by distance, from 5K to marathon, is part of Run-It Pro.
How the score fits with running form analysis
The Running Form Score sits on top of your Biomechanical Signature. For the full picture of how your form changes across pace, time and shoes, read the running form analysis guide. For what Loading Pattern Index measures, read the Loading Pattern Index explainer. To compare your own shoes across repeated runs, use the Garmin and Stryd shoe comparison guide.
Run-It methodology note
The Running Form Score groups your runs into easy, tempo and race pace zones and compares each factor with a target for that pace and type of run. Garmin runs are scored on Loading Pattern Index, Duty Factor and Vertical Ratio. Stryd runs use Impact Loading Rate, Leg Spring Stiffness and Vertical Ratio. The factor points add up to the score, and the Total Running Score is the average of the three types of run.
The Fatigue Resilience Score compares early and late stretches of medium and high confidence runs, allowing for pace. Extra ground contact and extra heart-rate effort each get a factor score, shown as mechanical and physiological fatigue. A factor stays at 75 or higher while ground contact rises by no more than about 3 percent, or heart-rate effort by no more than about 5 percent.
These scores offer directional guidance. They are model-based estimates, not validated scientific measurements. They do not diagnose fatigue, measure fitness or predict injury risk.
FAQ
How do I train my running form?
Compare your form at the same pace, pick the one factor with the widest gap, change one habit for a few weeks and check again. Run-It's Running Form Score does the comparison per type of run, so easy runs are never judged against race pace.
What is a running form score?
A running form score summarises how your running mechanics compare with a target for your pace and type of run. Run-It gives easy runs, tempo runs and race pace their own score out of 100, based on Garmin or Stryd data.
Why does running form change with pace?
Faster running shortens ground contact and lengthens the stride, and slower running does the opposite. Those changes are normal, so a fair comparison looks at runs of similar pace.
What is a good running form score?
There is no universal good score. Compare each score with your own earlier periods for the same type of run, and look at which factor is holding it back.
What is Duty Factor in running?
Duty Factor is the share of each full stride that a foot spends on the ground. It changes with pace, and less ground time is not automatically better, especially at easy paces.
What is Vertical Ratio in running?
Vertical Ratio compares how much you move up with how far you travel forward, using vertical oscillation and stride length. Some bounce is normal on easy runs, while at tempo and race pace the score looks for extra bounce to stay under control.
Does heart rate affect the Running Form Score?
No. Heart rate is not part of the Running Form Score. It is one of the two factors in the Fatigue Resilience Score, which checks whether the same pace needs more heart-rate effort late in a run.
What is the Fatigue Resilience Score?
The Fatigue Resilience Score shows how well your running holds up later in a run. Run-It scores easy runs, tempo runs and race pace from 0 to 100, based on extra ground contact and extra heart-rate effort late in the run after allowing for pace.
How often should I check my running form score?
Check it after a few weeks of similar runs, or after you have changed one habit. Use compare mode to set the new period against the old one.
Is the Running Form Score free?
Yes. The scores for easy runs, tempo runs and race pace are free, and so are the Total Running Score and the Fatigue Resilience Score. Filtering race pace by distance, from 5K to marathon, is part of Run-It Pro.
Which devices work with the Running Form Score?
Garmin runs with Running Dynamics and Stryd runs both work. Some Garmin watches record Running Dynamics from the wrist, while other models need an accessory such as HRM-Pro or the Running Dynamics Pod.
Sources
- Van Hooren et al., Sports Medicine (2024): systematic review and meta-analysis of running biomechanics and running economy.
- Heiderscheit et al., Medicine & Science in Sports & Exercise (2011): effects of step rate manipulation on joint mechanics during running.
- Bonnaerens et al., BMJ Open Sport & Exercise Medicine (2021): duty factor and external forces in slow recreational runners.
- Trowell et al., Sports Biomechanics: systematic review and meta-analysis of running-induced fatigue during overground running.
- Garmin HRM-Pro Plus Owner's Manual: Running Dynamics, including vertical ratio and ground contact time.
- Stryd Help Center: Stryd metrics, including Leg Spring Stiffness and Impact Loading Rate.
- Joe Friel, TrainingPeaks: Efficiency Factor and aerobic decoupling.