
Quick answer
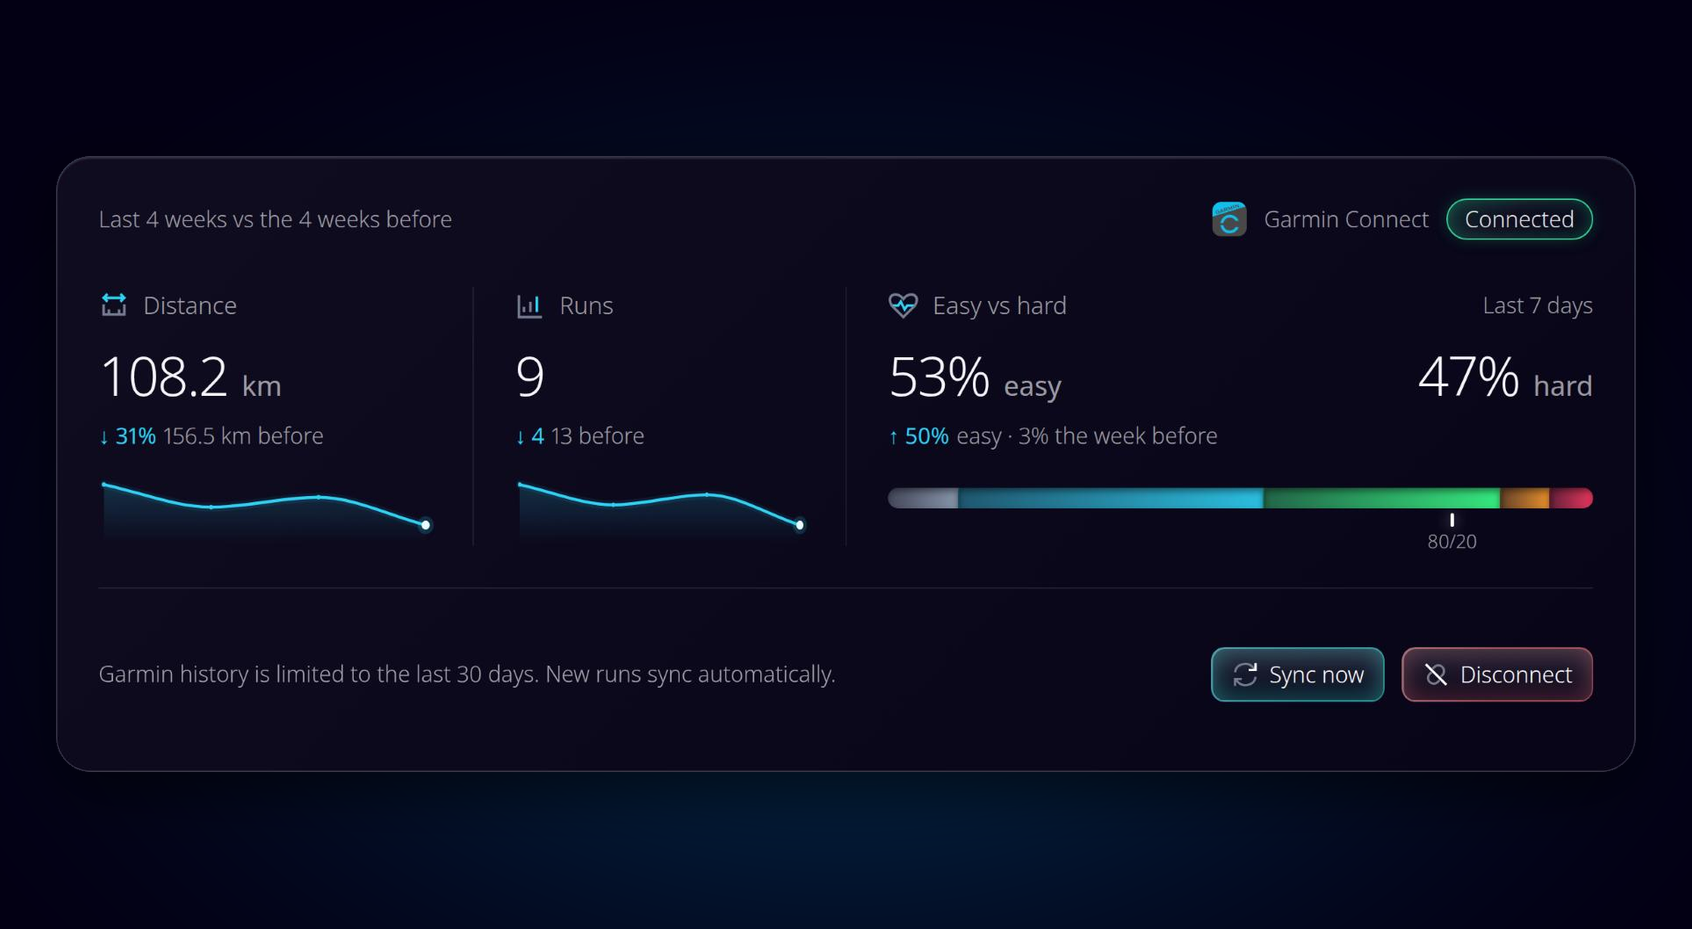
80/20 running means doing about 80% of your running at an easy effort and about 20% harder. Run-It's My Runs overview shows your own split for the last 7 days, worked out from your heart-rate zones, next to the week before, so you can see whether your easy running is really easy.
What 80/20 running means
The idea comes from watching how good endurance athletes train. In a review of that research, Stephen Seiler found that national and international level athletes did about 80% of their training sessions at low intensity and about 20% with hard work such as intervals. In an earlier study of 11 well-trained junior cross-country skiers, Seiler and Kjerland counted about 75% of endurance sessions in the lowest of three zones, and 15 to 20% clearly above the threshold zone.
That is where “80/20” comes from. It is a description of what many of the best athletes do, and a common guideline for everyone else. It is not a law. A 2019 meta-analysis compared polarized training with threshold training in trained athletes and found a moderate advantage for polarized training on time trials, but it rested on only 3 small trials. Treat 80/20 as a sensible starting point, not a target you have to hit every week.
The hard part is not the hard sessions. It is keeping the easy runs easy. A weekly view helps, which is why Run-It already sends a weekly recap of your running every Monday. The Easy vs hard card puts the intensity of that week on screen too.
How Run-It counts easy and hard
How the Easy vs hard card counts
Source: Run-It app, Easy vs hard on the My Runs overview, checked 18 November 2026
Run-It splits your running time over your five heart-rate zones. Time in Zones 1 and 2 counts as easy, time in Zones 3, 4 and 5 counts as hard. The card shows both as a percentage of your running time in the last 7 days, and the line under the numbers compares your easy share with the 7 days before, for example “↑ 6% easy · 74% the week before”.
It counts time, not runs. That matters, because the research above mostly counted sessions. An interval session holds a warm-up, recoveries and a cool-down, and those minutes often sit in your easy zones. A week of four easy runs and one interval session is 80/20 by sessions, but by time it usually shows more than 80% easy. Seiler and Kjerland compared several ways of counting for exactly this reason.
Want to see your own split? Connect your watch to Run-It for free and open My Runs.
Reading the card
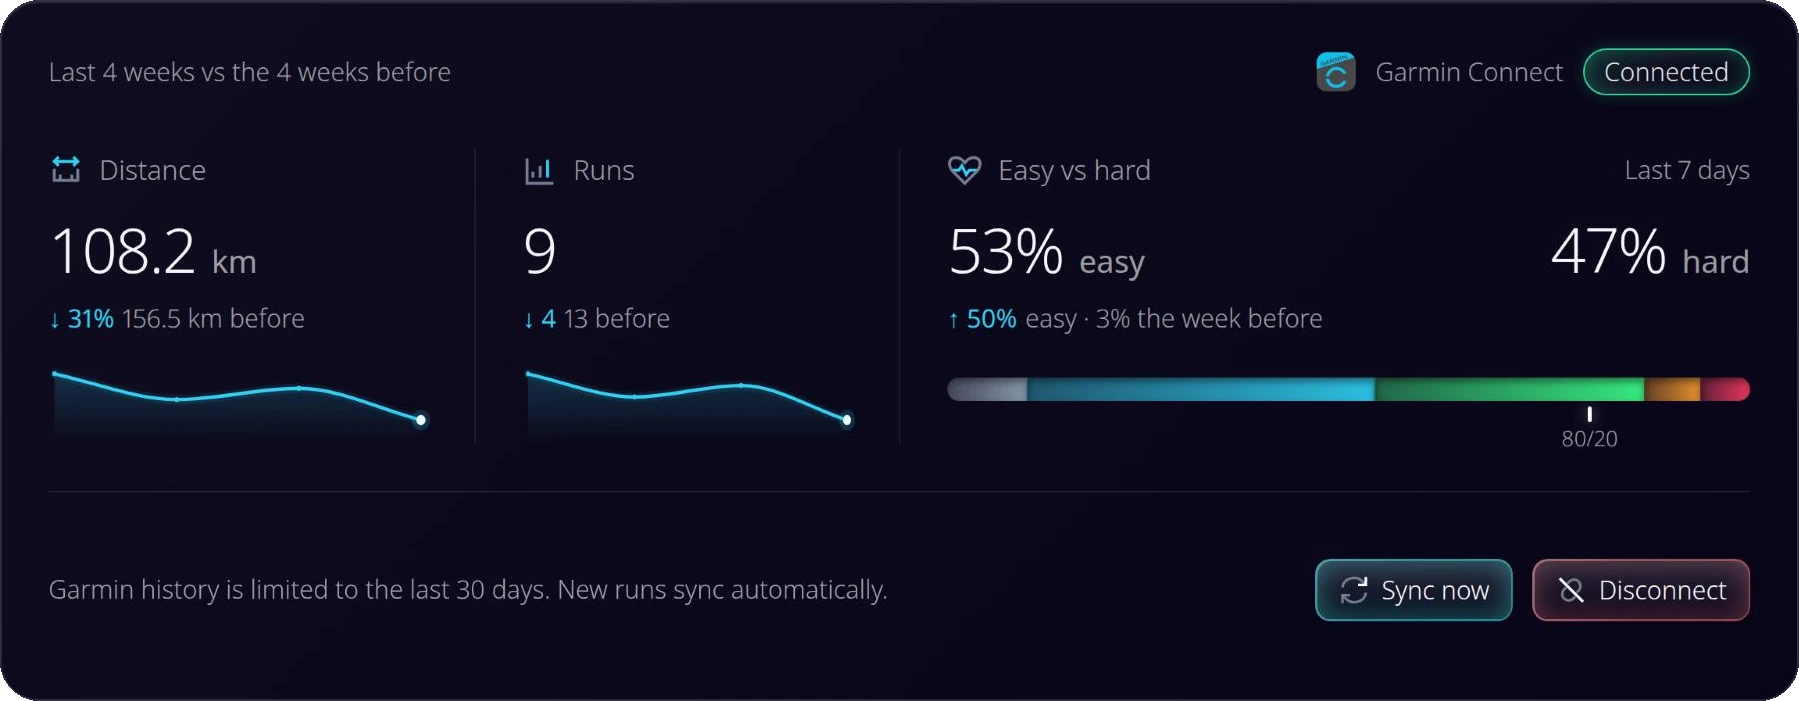
1. The two numbers. “x% easy” on the left and “y% hard” on the right. They always add up to 100.
2. The comparison. An arrow and the change in your easy share, then the easy share of the week before. “Same” means no change.
3. The bar. One bar in the zone colours from Settings: grey for Zone 1, cyan for Zone 2, green for Zone 3, orange for Zone 4 and red for Zone 5. Each colour is as wide as the time you spent in that zone.
4. The 80/20 tick. A small mark at 80% of the bar. If grey and cyan reach the tick, at least 80% of your time was easy.
A few messages replace the numbers when there is nothing to count. “No heart rate in the last 7 days” means none of your recent runs had heart rate, for example treadmill runs without a strap or no runs at all. “No heart rate the week before” means there is nothing to compare with yet. “Heart rate unavailable” means the numbers could not be loaded.
The card sits next to Distance and Runs, which compare four weeks. It took the place of Time running and Average pace on the overview. The rest of the page, the activity log and each run's own page, stays the same; this guide to reading your running form data walks through those.
Set your heart-rate zones first
The split is only as good as your zones. In Settings, under Heart-rate zones, you set the bpm where Zones 2 to 5 start; Zone 1 is everything below the first threshold. If you never change them, Run-It uses fixed defaults: Zone 2 from 120, Zone 3 from 140, Zone 4 from 160 and Zone 5 from 180 bpm.
The defaults are not your zones
The default zones are the same for everyone. They are not worked out from your maximum heart rate or a test. Maximum heart rate drops with age and differs between people, so 140 bpm can be a hard effort for one runner and an easy jog for another. If your easy runs show up as hard, change the zones in Settings to the ones you use on your watch or got from a test.
The zones are saved to your account, so the same zones colour the heart-rate charts on your Garmin and Stryd pages. Changing them changes the split straight away, for this week and the week before.
Where the numbers come from per source
Run-It reads the heart-rate stream of each run and adds up the time in each zone.
Each run counts whole in the zone of its average heart rate. The label then reads “Last 7 days*”.
A gap of more than 10 seconds between heart-rate samples counts as a pause, not as running time.
A run with fewer than 60 heart-rate samples counts at its average and is marked as estimated.
The star matters for Strava runners. An interval run of 45 minutes with an average of 150 bpm counts as 45 minutes in one zone, although part of it was easy and part of it was hard. Hover over “Last 7 days*” to see how many runs were counted at their average heart rate. Garmin and Stryd do record more, which how Garmin and Stryd data differ in Run-It explains in detail.
If you upload activity files instead of syncing, the heart rate comes from the file. What a FIT file needs to contain for Run-It covers which files work.
Why a week drifts away from 80/20
A single week can look far from 80/20 for ordinary reasons. A race or a hard group run in a short week weighs heavily. Hills, heat and long climbs push heart rate up at an easy pace. A week with only two runs, one of them a workout, can easily read 50/50. The comparison with the week before is there to show a trend, not to judge one week.
How runners describe their own runs gives a hint too. In Run-It data, 59% of runs are logged as daily runs, 23% as tempo runs and 18% as interval runs (Run-It data, 11,700 runs, pulled 17 November 2026). That is a split of run types, not of heart-rate time, but it shows that two in five runs are planned as something harder than easy.
Easy days and workout days often go with different shoes as well. If you rotate pairs, a running shoe rotation built from your data shows which shoe you use for which kind of run, and the Run-It Shoe score compares pairs at the same effort, so a hard week does not make a shoe look worse.
What the card does not do
The card shows how your week was spread. It does not plan workouts, it does not tell you what your split should be and it is not a polarized training analysis. Walks, rides and strength sessions are not part of it: it reads the runs from your connected source. If you want to work on how you run rather than how hard, training your running form with the Running Form Score and a strength plan picked from your own form are the next steps.
New to Run-It? The card uses the same runs as the free running shoe analysis, so connecting your watch once gives you both.
FAQ
What counts as easy in Run-It?
Time in Zones 1 and 2 of your heart-rate zones counts as easy. Time in Zones 3, 4 and 5 counts as hard. The zones are the ones you set in Settings, under Heart-rate zones.
Does the card count time or number of runs?
Time. Run-It adds up the minutes you spent in each zone over the last 7 days. One interval session can therefore be part easy and part hard.
Why does my split look wrong?
The most common reason is zones that do not fit you. The defaults start Zone 2 at 120, Zone 3 at 140, Zone 4 at 160 and Zone 5 at 180 bpm, and they are not worked out from your own heart rate. Runs without heart rate are left out, and Strava runs count whole at their average heart rate.
What does the star after Last 7 days mean?
It means some runs were counted at their average heart rate instead of second by second. Hover over the label to see how many. This happens for every Strava run, and for a run with too few heart-rate samples.
Which sources work?
Garmin, Stryd, Apple Health and Strava. Garmin, Stryd and Apple Health runs use the heart-rate stream of each run. Strava gives one average heart rate per run.
Is 80/20 right for me?
It is a common guideline that comes from how many elite endurance athletes train, and studies on it are small. Run-It shows your split. It does not plan your training or say what your split should be.
Sources
- Seiler S. What is best practice for training intensity and duration distribution in endurance athletes? International Journal of Sports Physiology and Performance, 2010;5(3):276-291. Accessed 18 November 2026.
- Seiler KS, Kjerland GØ. Quantifying training intensity distribution in elite endurance athletes: is there evidence for an “optimal” distribution? Scandinavian Journal of Medicine & Science in Sports, 2006;16(1):49-56. Accessed 18 November 2026.
- Rosenblat MA, Perrotta AS, Vicenzino B. Polarized vs. threshold training intensity distribution on endurance sport performance: a systematic review and meta-analysis of randomized controlled trials. Journal of Strength and Conditioning Research, 2019;33(12):3491-3500. Accessed 18 November 2026.
- Tanaka H, Monahan KD, Seals DR. Age-predicted maximal heart rate revisited. Journal of the American College of Cardiology, 2001;37(1):153-156. Accessed 18 November 2026.
- Run-It My Runs overview, Easy vs hard card, and Settings, Heart-rate zones. Accessed 18 November 2026.